
Short-Term Strategies After Extreme Swings
In this article, we will discuss extreme price increases in daily cryptocurrency values. Last week, we witnessed a significant surge of over 60% in the price of XRP. Although such percentages remain rare for the largest cryptocurrencies, it is not uncommon to observe increases or decreases of more than 5% or 10%. Our first figure displays a scatter plot showing the number of days with price increases or decreases of more (or less) than 5% since 2018. The growth rate in our graph is estimated using daily opening prices. One notable observation is that XRP is the most volatile, followed by ETH and BTC. We can also notice the significant drop at the beginning of the COVID pandemic in 2020.

The occurrence of large daily price changes varies among cryptocurrencies. For instance, during the observed period, BTC experienced a 5% or higher increase or decrease 13.7% of the time, while a 10% change occurred 2.8% of the time. For ETH, these figures were 21.9% and 5.2%, and for XRP, they were 22.6% and 6.3%. Thus, ETH and XRP appear to be similar in this regard, compared to BTC. By narrowing the scope to the early months of 2021, there is a marked decrease in extreme price increases, and some differentiation between ETH and XRP, with a 10% price change appearing 1.1% for BTC, 2.1% for ETH, and 3.0% for XRP. This indicates that larger market capitalization reduces volatility.
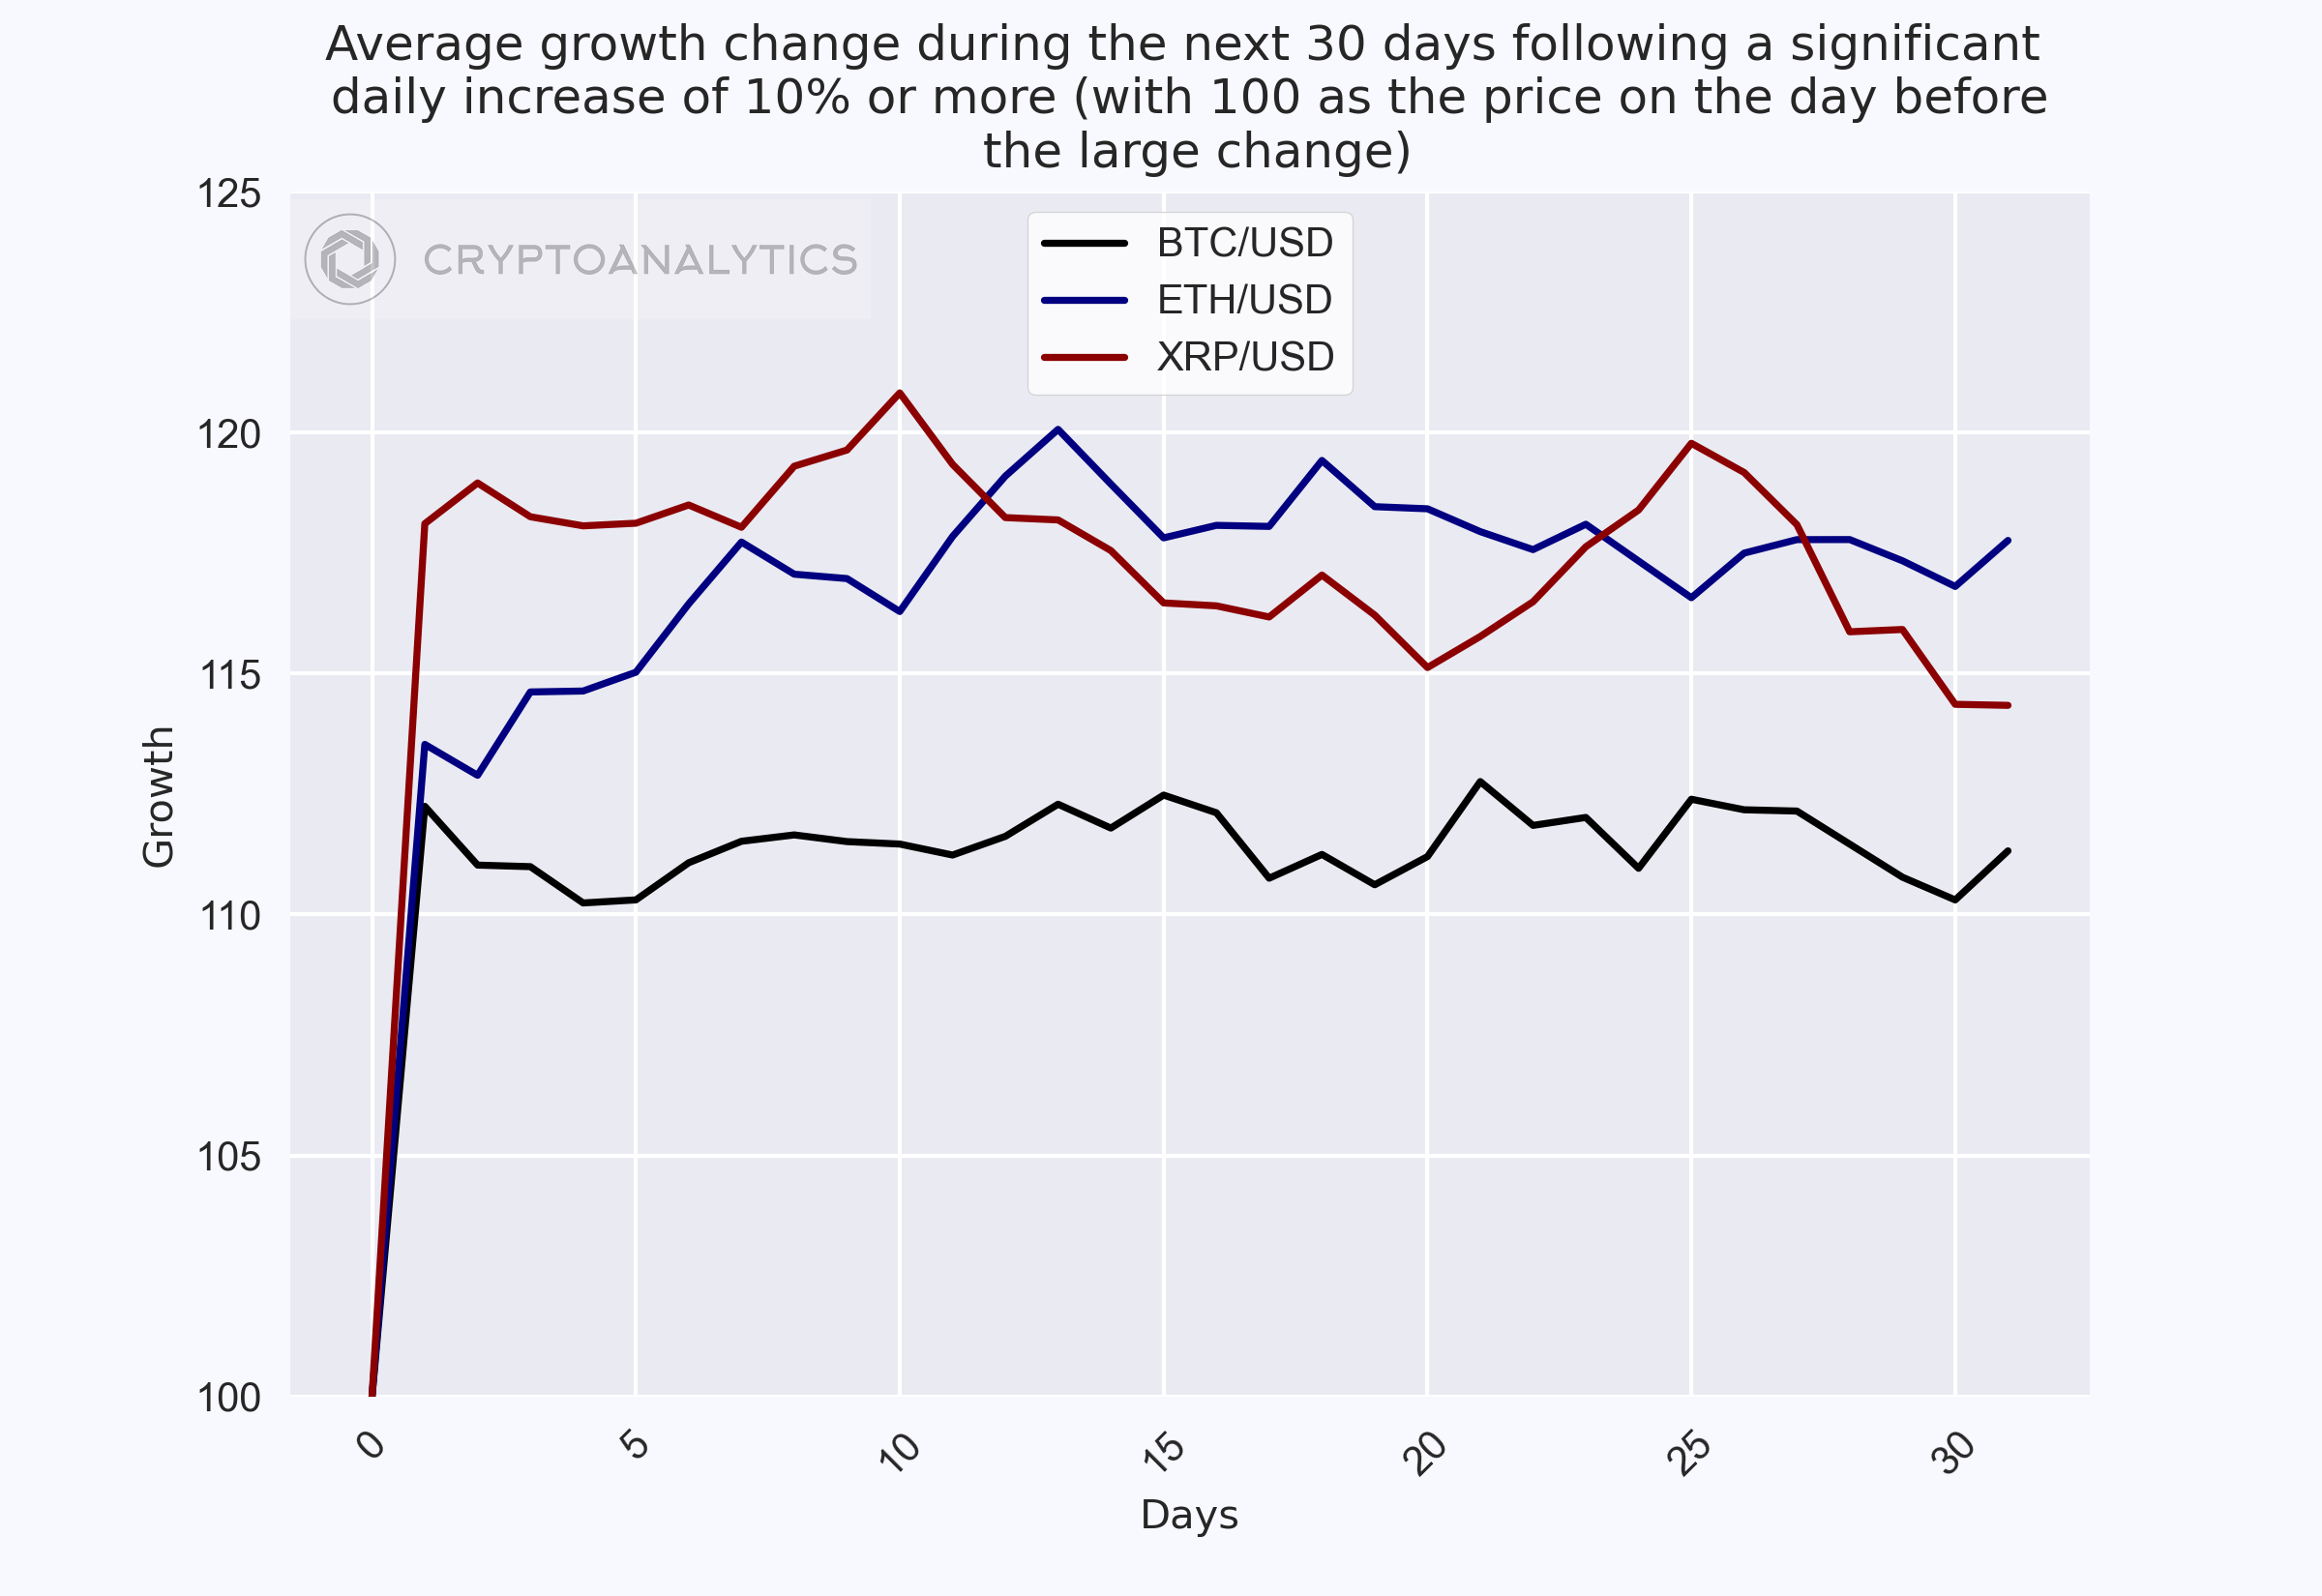
When significant price changes occur, there is often a FOMO/FUD episode, meaning people rush to buy or sell following the price change. Is this a good idea? To assess whether it is a winning short-term strategy, we calculated the average price change following extreme price variations. Precisely, we analyzed the price trajectory during the 30 days after the extreme price change, with 100 as the initial index before the extreme variation. The following graph shows the average of these trajectories for increases of 10% or more. Day 0 represents the baseline price, 100, and day 1 is the average of the extreme price increases. On average, when prices increased by more than 10%, BTC had the smallest increase (12%), followed by ETH at almost 14%, and XRP at almost 18%. Over the 30-day period following the increase, BTC maintained the new price, ETH increased by 4% from the hike, and XRP decreased by just under 4% compared to the new price.
Looking at price decreases, we see that BTC tends to recover following the initial drop, while ETH remains constant, and XRP decreases further, although it initially recovers in the first few weeks before plunging again towards the last week.

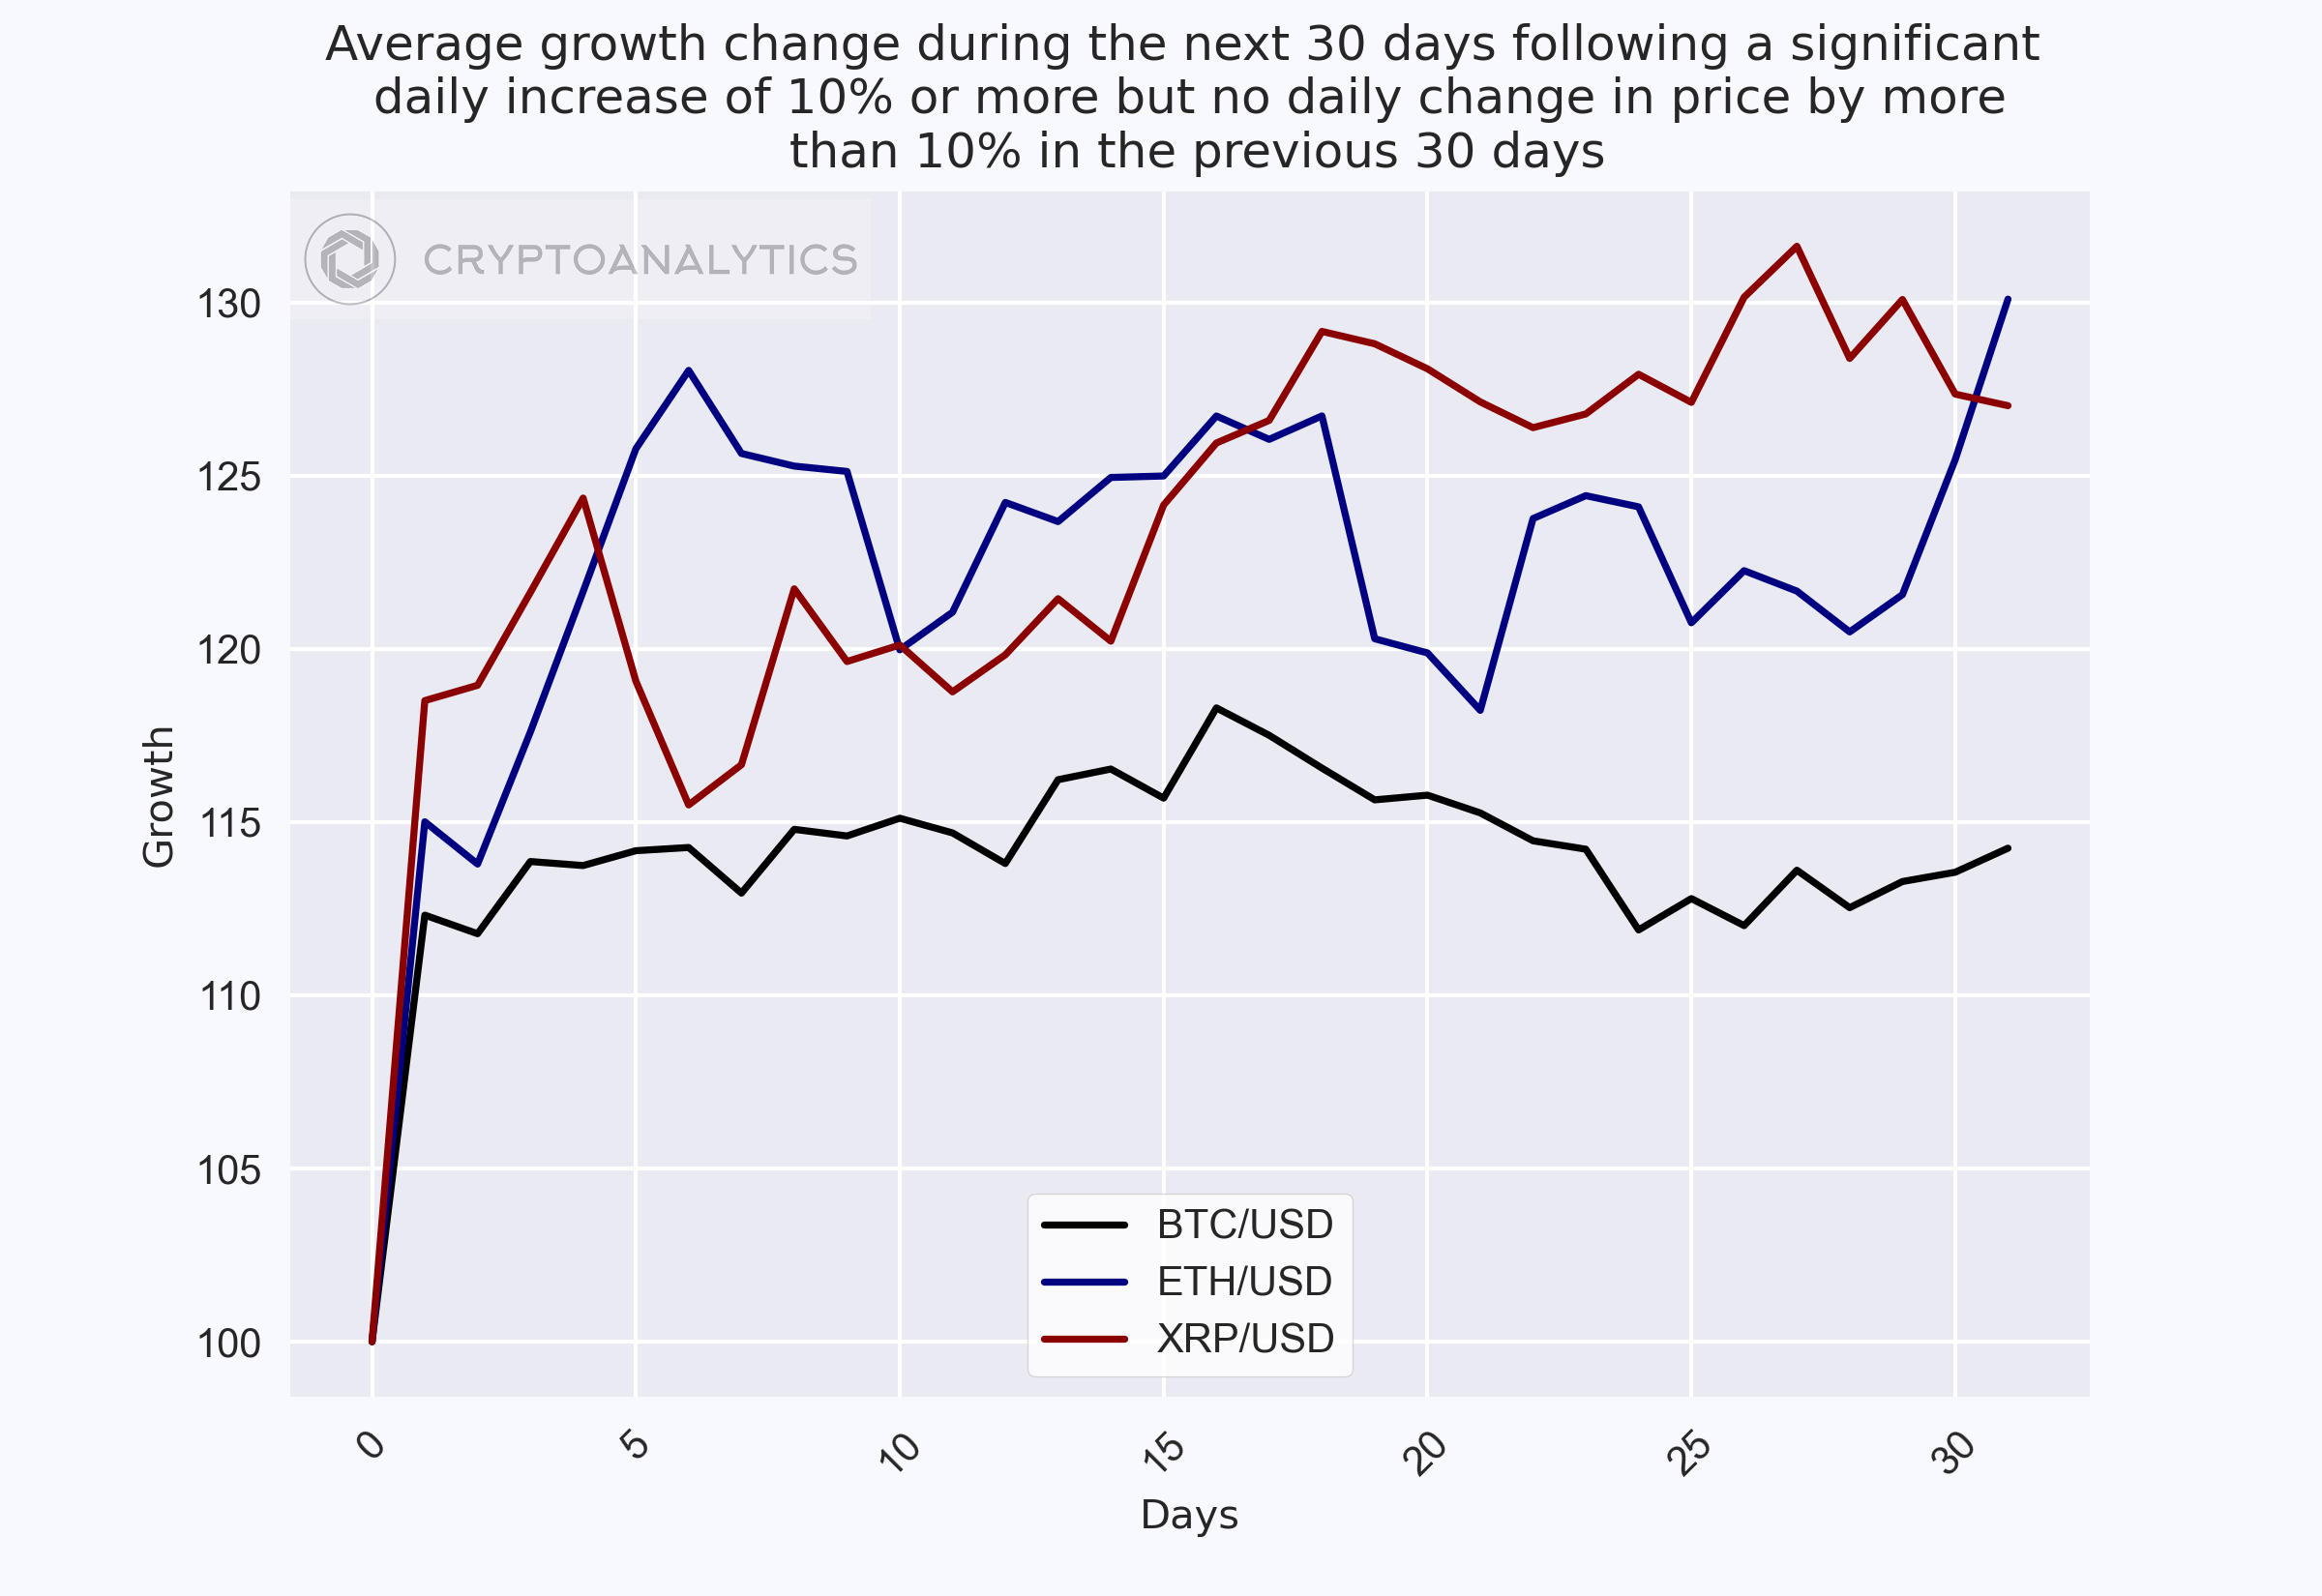
Looking ahead for the next 30 days after all significant increases or decreases might be misleading, as large movements in one direction are often followed by opposite movements. For example, XRP's 70% increase was followed by a 15% decline. What about spontaneous extreme changes that were not followed by other extreme changes? For this scenario, we calculated the average trajectory only for cases where there were no extreme price changes of more or less than 10% in the previous 30 days. As we can see in the following graph, all cryptocurrencies, on average, increased following a spontaneous price hike. BTC showed a small increase, followed by XRP, while ETH had the most significant increase.
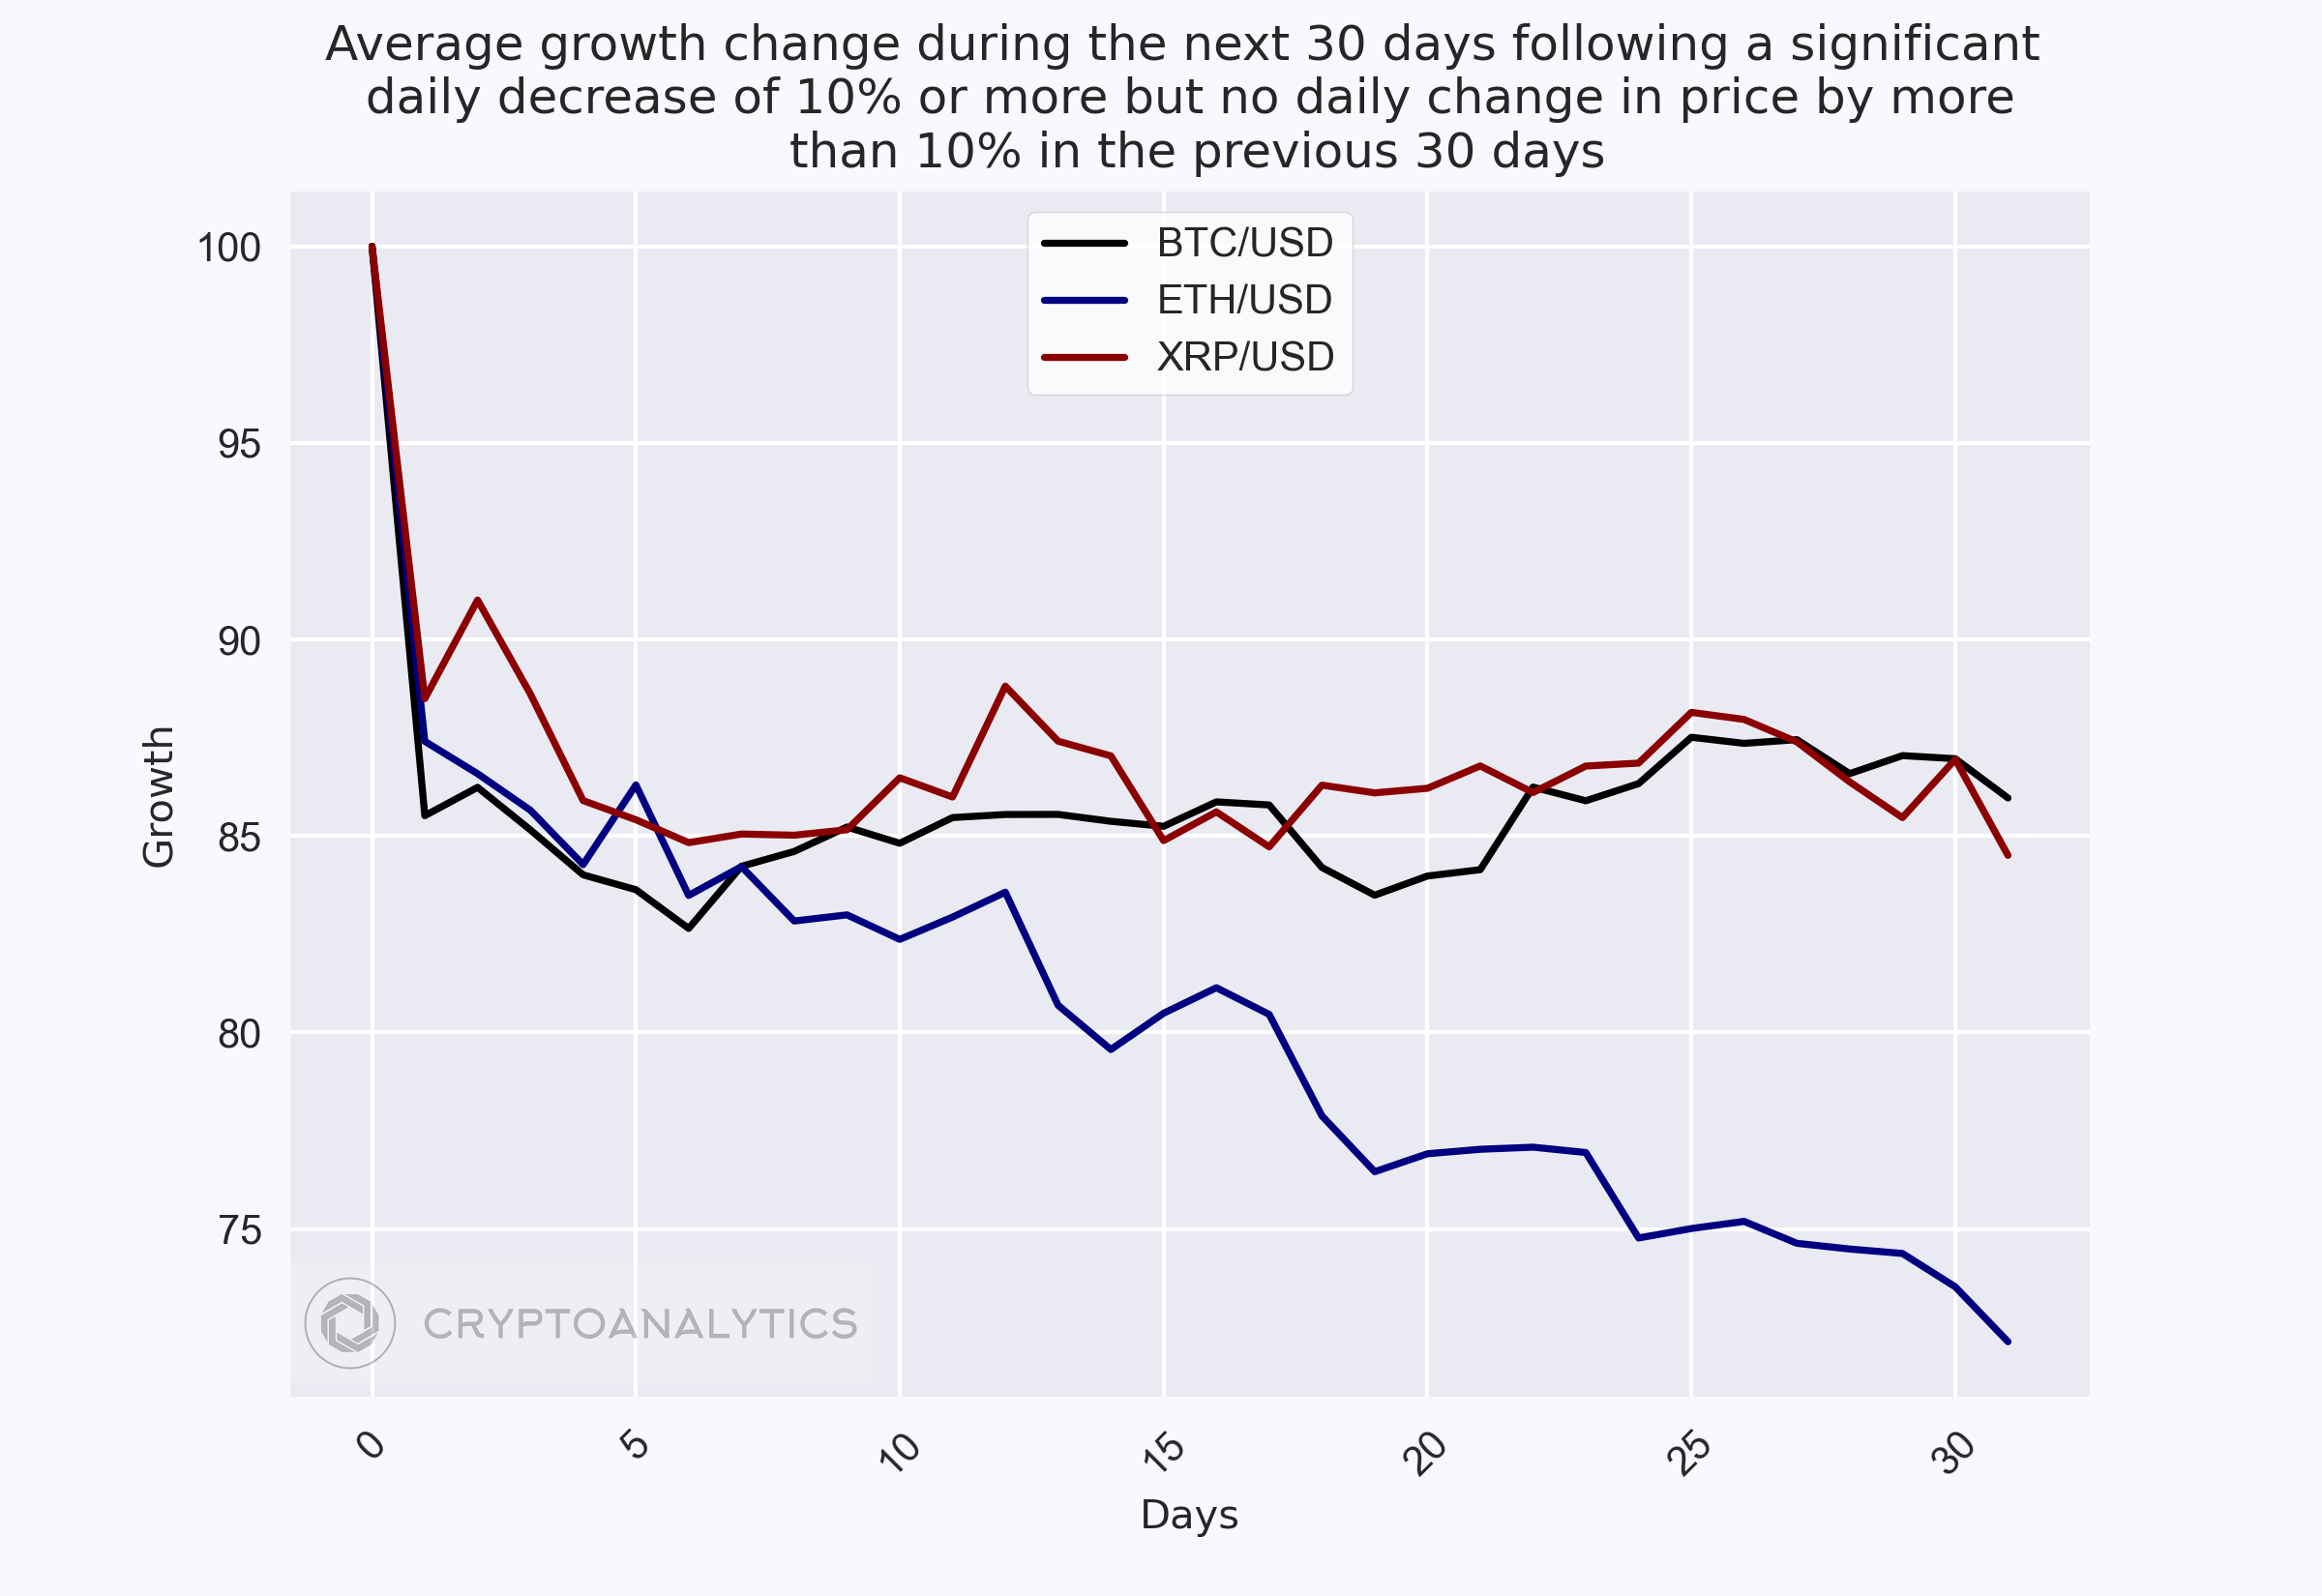
For spontaneous price decreases, BTC remained steady on average, XRP decreased more, and ETH showed the most significant decline.
Although this analysis hides several dynamics, it appears that from 2018 to 2023, during a period of high market volatility, an extreme price change did not necessarily indicate a short-term price change. However, when the change was preceded by a calm period, the price tended to move in the same direction on average in the short term. Finally, note that a heavily capitalized coin like BTC exhibited little short-term movement. In this case, short-term FOMO could be ill-advised.