
Decoding Cryptocurrency Trading Volume (part 1)
In this article, we aim to provide an in-depth analysis of the extensive field of cryptocurrency trading volume, specifically focusing on the BTC to USD pair. It is crucial to specify that trading volume primarily originates from centralized exchange platforms and specific trading pairs. This introduces two additional layers of complexity when assessing the volume of BTC in USD. Firstly, the value of USD is often represented by multiple stablecoins such as USDT, BUSD, USDC, and DAI. Furthermore, when examining the total volume between BTC and fiat currency, it is necessary to consider that certain exchanges facilitate direct transactions in dollars or other currencies like the Euro or Canadian dollar. Secondly, there are various centralized and decentralized markets, and the trading volume should encompass the cumulative sum across all markets simultaneously, including certain ETFs and over-the-counter exchanges. Although this article primarily focuses on Binance, the largest exchange market by a significant margin, relying solely on one exchange may present challenges in interpreting volume variations. However, it is worth noting that there is a substantial correlation between the volume on Binance and the total volume, indicating that a notable change in transaction volume on Binance generally corresponds to a significant change in volume in the same direction. The initial figure illustrates the volume on Binance for the most renowned stablecoin pairs with BTC/USD fro, the beginning of 2021 to today.

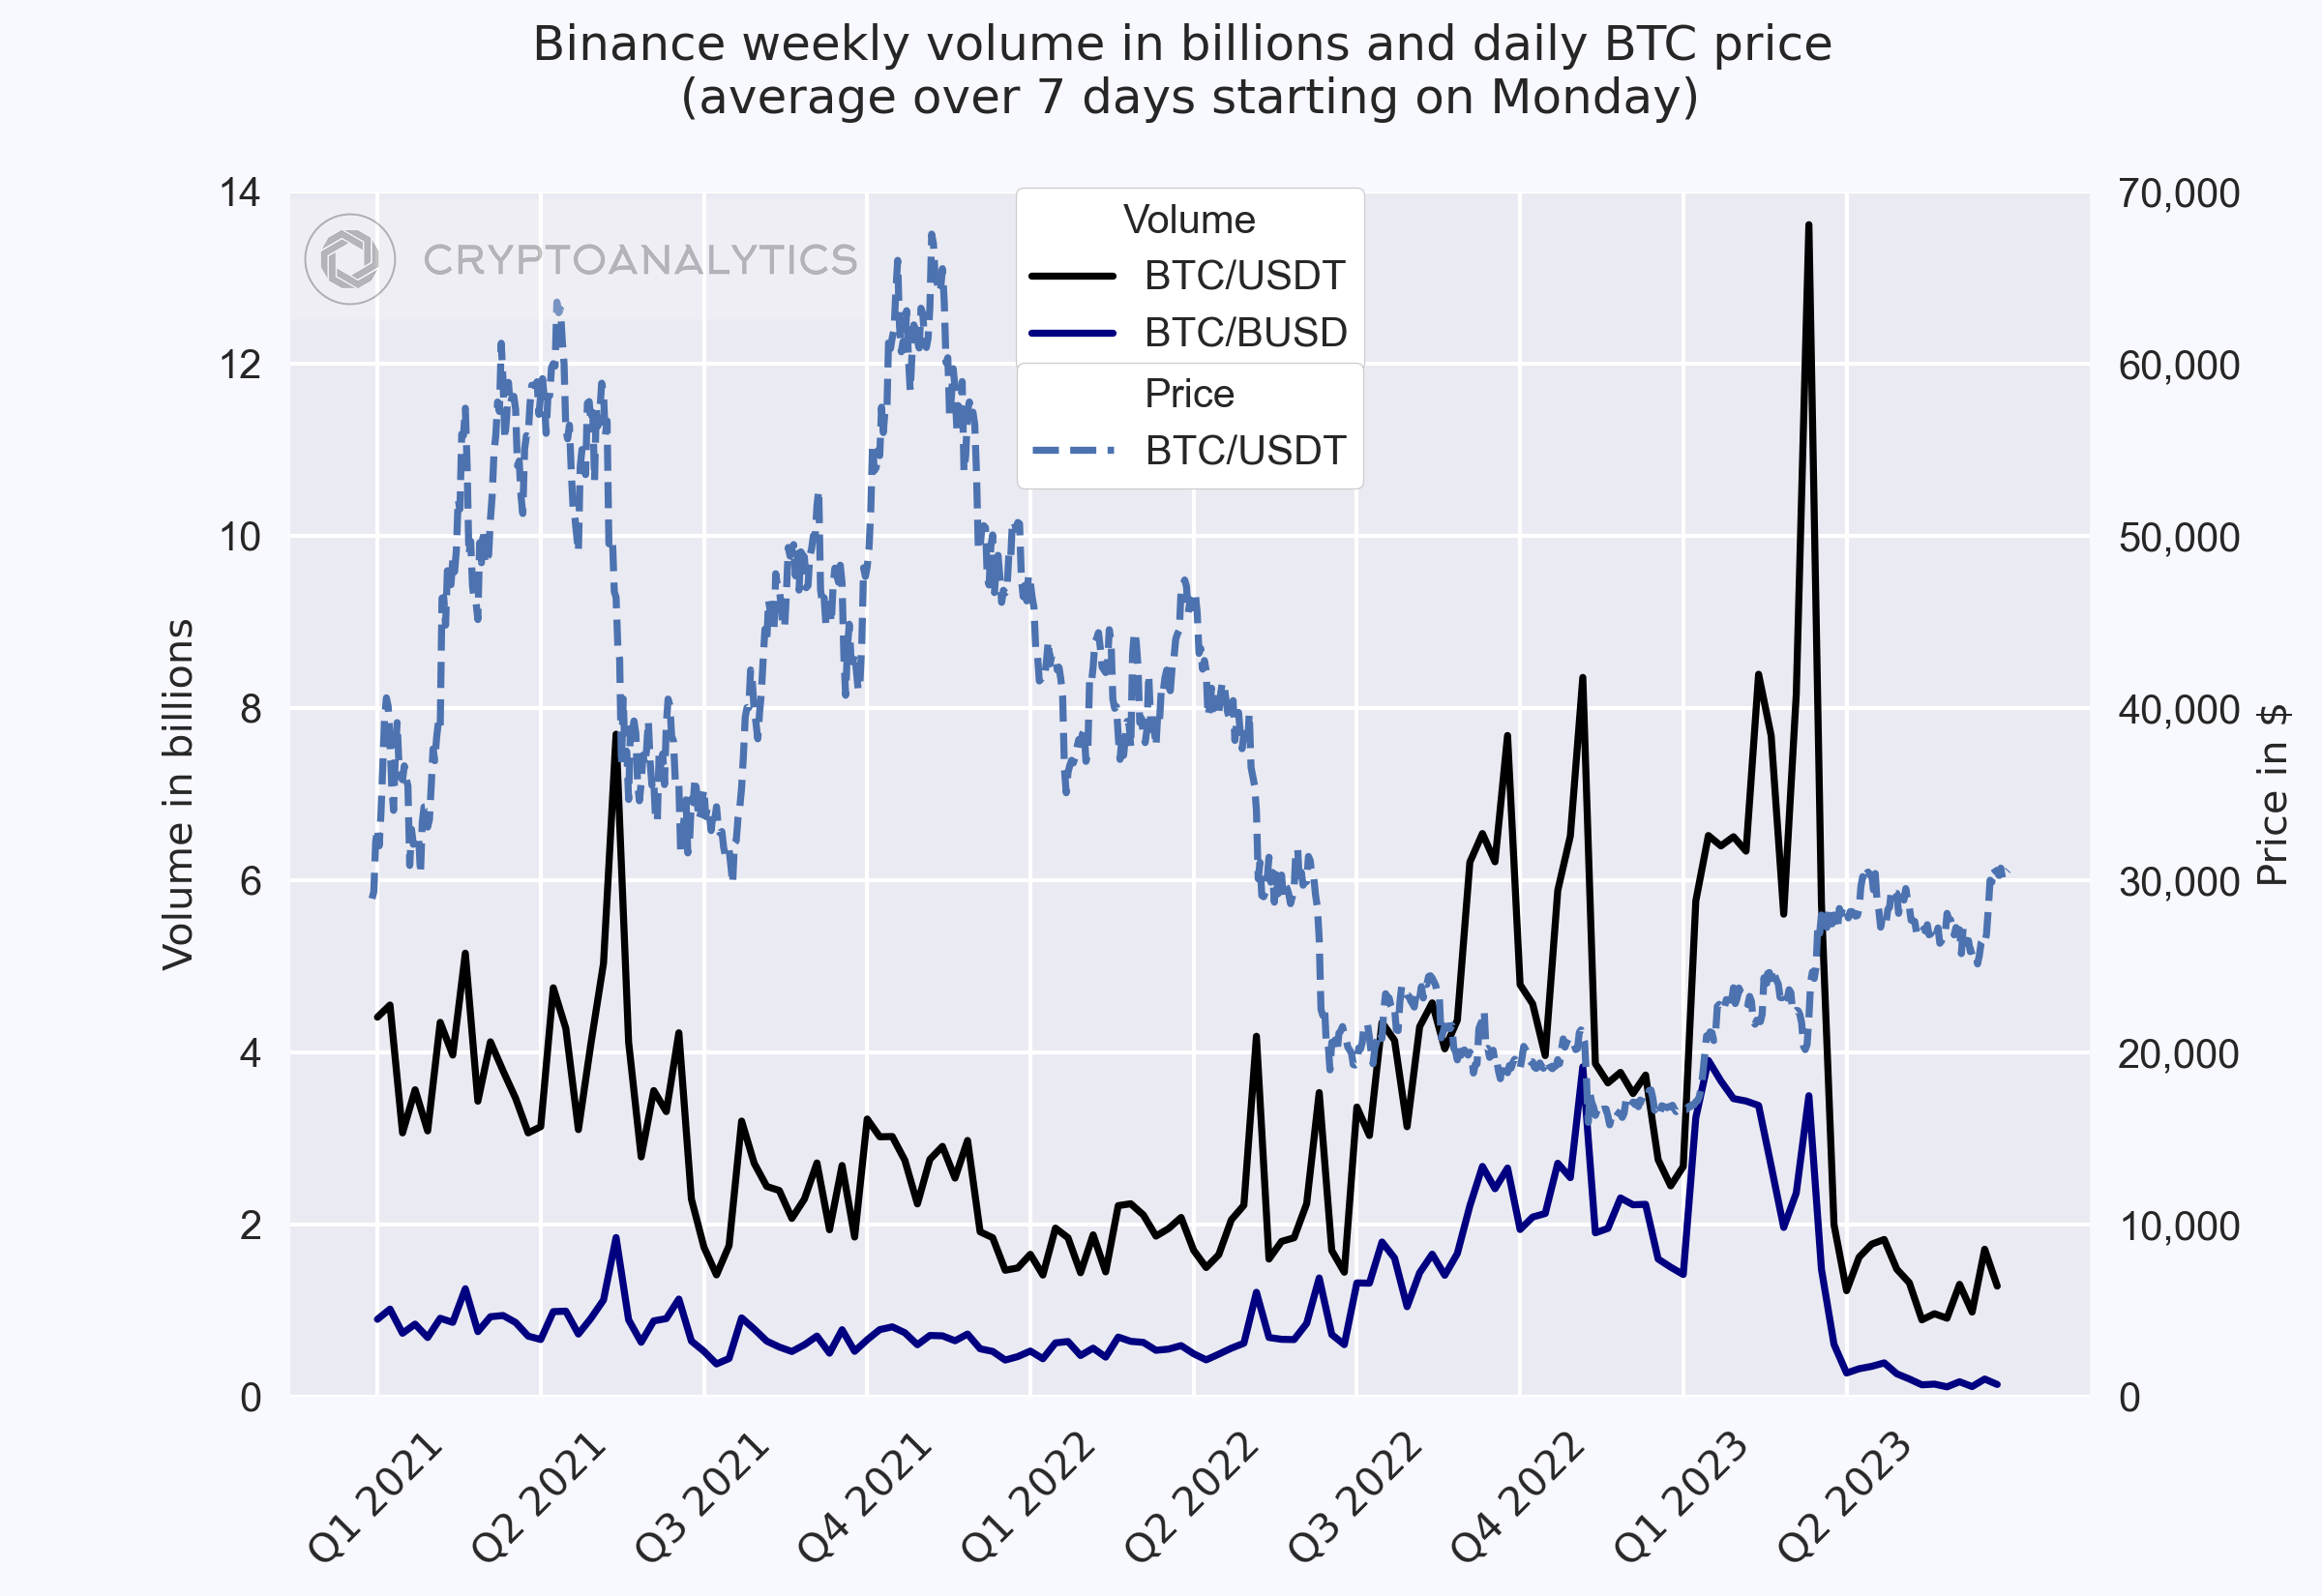
The BTC/USDT pair exhibits the highest volume on Binance, with an average daily volume ranging from the beginning of 2021 to the present day amounting to 3.8 billion. This is followed by BUSD with 1.3 billion, BTC/USDC with 114 million, and BTC/DAI with slightly over 5 million. However, it is important to recognize that volume variations among pairs do not necessarily imply changes in overall trading volume. For instance, in September 2022, Binance removed three stablecoins from its platform, including USDC, resulting in the BTC/USDC pair dropping to zero. Similarly, in February 2023, the issuer of BUSD received a notice from the SEC, subsequently suspending the issuance of new currency, leading to the disappearance of the stablecoin, as evident from the graphical representation. Therefore, the rapid increase in BTC/USDT volume and the subsequent decrease are not directly linked to the demand for BTC but rather to the dynamics among stablecoins on Binance.
When comparing the price and volume of the BTC/USDT pair (next figure), it becomes apparent that the volume has been declining since the beginning of 2021, but it experienced an upswing from the second quarter of 2022. However, since the second quarter of 2023, the volume has declined while the price has been rising. The significant increase in volume during the first quarter of 2023 can be attributed to a substantial decreased of BUSD to Binance and a possible decline in the confidence in various stablecoins. For instance, individuals with reduced trust in USDT may opt to shift towards BTC. However, this may only indicate a short-term price increase for BTC, as transacting in BTC is more convenient compared to completely exiting the market in USD.
The cryptocurrency market operates 24 hours a day, 7 days a week. In the preceding graphs, we calculated the average volume per day over a week since volume is heavily influenced by the day of the week. The following graph depicts a box plot illustrating the volume per day during the aforementioned period. The green line represents the median, and the dashed red line signifies the average. The circles beyond the boxes indicate extreme values outside the confidence interval surrounding the average. With 130 weeks under consideration, it is observable that there are a relatively high number of extreme values, a typical occurrence in the cryptocurrency market, potentially associated with its emergence. Additionally, a significant decrease in volume is evident during weekends, and extreme values typically occur at the beginning of the week and on Fridays, with a slightly lesser occurrence on Wednesdays, Thursdays, Saturdays, and Sundays.

Further volume indicators can be calculated on a daily basis. The subsequent figure displays the percentage of weeks where a day had the highest volume percentage. This percentage reduce the effect of extreme values; however, it is necessary to identify the typical week from Monday to Sunday. For example, if volume is affected by news on a Sunday and then on a Monday, those two days would not be considered part of the same week, despite their consecutive occurrence. According to the figure, only 10% of the weeks exhibited the highest volume at the end of the week, while each day during the week had a probability between 20% and 30% of having the highest volume. Generally, Wednesdays displayed the highest probability.

In conclusion, it is important to note that the volume of BTC in USD does not necessarily represent the volume in BTC, despite the often correlated movement between BTC and USD. The presence of an extensive number of trading pairs between BTC and altcoins highlights the need to consider various pairs, such as the BTC/ETH pair, which corresponds to the existence of an ETH/USDT pair as well. Consequently, it is apparent that utilizing these pairs successively indirectly facilitates a BTC/USD transaction. In future articles, we will explore different methods of aggregating data to obtain more precise measurements of overall volume.